1.1 — When Linear Breaks Down
The Problem: A Ball in the Air
You throw a ball straight up. A friend records the height at three moments:
| Time (seconds) | Height (meters) |
|---|---|
| 0 | 2 |
| 1 | 17 |
| 2 | 22 |
You already know how to handle data like this — find the rate of change and write a linear equation. So let's try it.
Between $t = 0$ and $t = 1$, the ball rises $15$ meters per second. That gives us the line:
$$y = 15t + 2$$
Check: at $t = 0$, $y = 2$. At $t = 1$, $y = 17$. Both correct.
But at $t = 2$, this line predicts $y = 32$. The actual height is $22$.
The line misses by $10$ meters. Something is wrong — not with the data, but with the assumption that a straight line is the right model.
The key question: If a line can't capture this pattern, what kind of expression can?
Why Lines Fail: The Rate of Change Isn't Constant
Let's look more carefully at what's happening between the data points.
| Interval | Change in height | Rate of change |
|---|---|---|
| $t = 0$ to $t = 1$ | $+15$ | $15$ m/s |
| $t = 1$ to $t = 2$ | $+5$ | $5$ m/s |
The ball is slowing down. The rate of change itself is changing.
Linear functions have one defining property: the rate of change is constant. The slope is the same everywhere. That's exactly what makes them simple — and exactly what makes them inadequate here.
When the rate of change isn't constant, a line can still fit two points, but it will bend away from reality everywhere else. We need something more flexible.
If this idea of "rate of change" feels fuzzy, here's a simple test: in a table of values with equally spaced inputs, a linear function produces the same difference between consecutive outputs every time. The moment those differences start varying, you're looking at something nonlinear.
MathBox Visualization
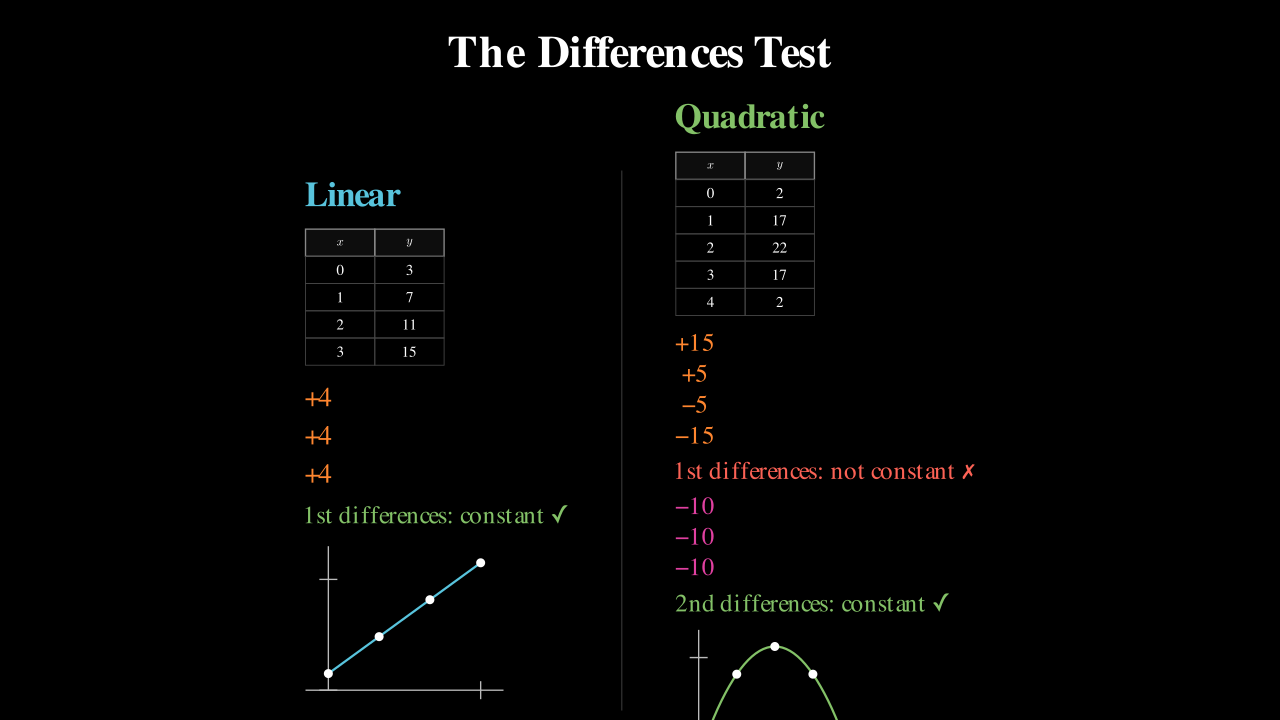
Spotting Quadratic Patterns: The Second Differences Test
The rate of change is changing — but is it changing in a predictable way? Let's find out.
Add more data points and compute the differences between consecutive heights (these are called first differences):
| $t$ | Height | First difference |
|---|---|---|
| 0 | 2 | |
| 1 | 17 | $+15$ |
| 2 | 22 | $+5$ |
| 3 | 17 | $-5$ |
| 4 | 2 | $-15$ |
The first differences are $15, 5, -5, -15$. They aren't constant (not linear), but notice: each first difference is $10$ less than the one before.
Now compute the differences of the differences — the second differences:
| First difference | Second difference |
|---|---|
| $15$ | |
| $5$ | $-10$ |
| $-5$ | $-10$ |
| $-15$ | $-10$ |
The second differences are all $-10$. Constant.
This is the signature of a quadratic pattern:
For linear functions, the first differences are constant. For quadratic functions, the second differences are constant.
This is a simple, powerful test you can apply to any table of equally spaced data. If the first differences aren't constant but the second differences are, you're looking at a quadratic relationship.
Check your understanding
Before reading on, look at this table:
$x$ $y$ 0 3 1 5 2 11 3 21 4 35 Is this data linear, quadratic, or neither? Compute the first and second differences to decide.
Check your answer
First differences: $2, 6, 10, 14$. Not constant, so not linear. Second differences: $4, 4, 4$. Constant! This is a **quadratic** pattern.First Look at $y = ax^2 + bx + c$
We know this data follows a quadratic pattern. But what does a quadratic expression actually look like?
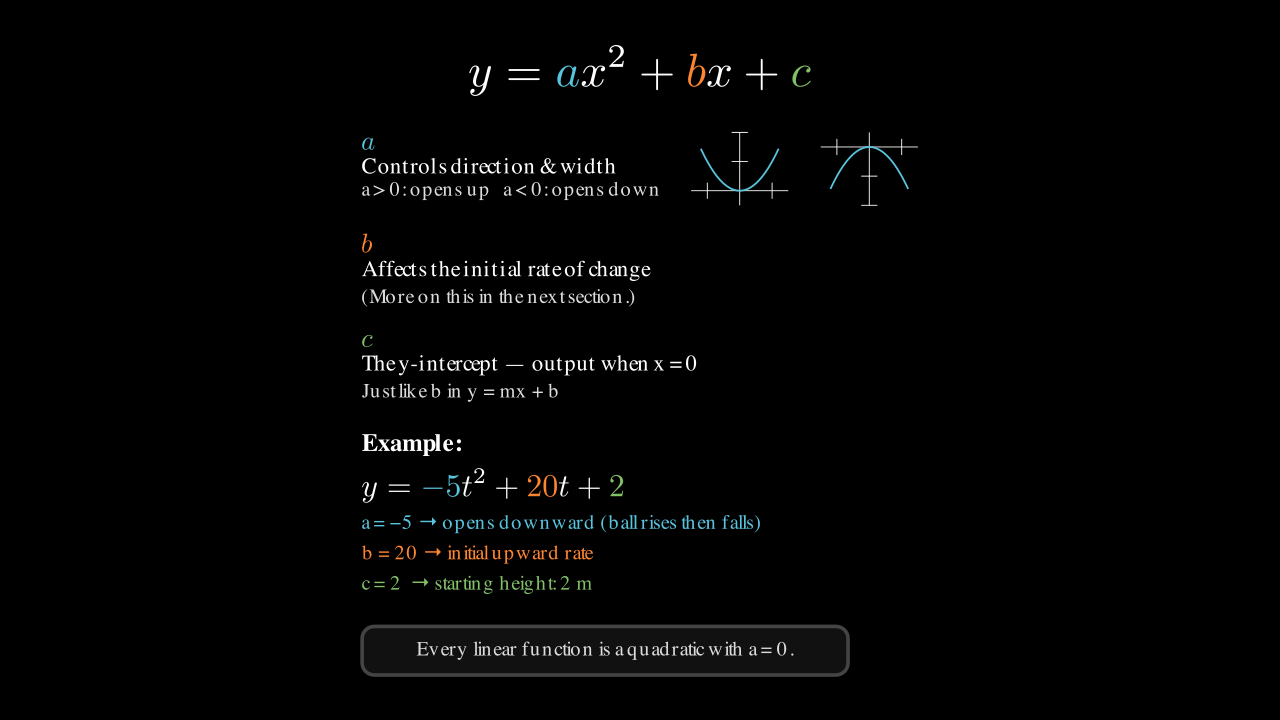
The most general form is:
$$y = ax^2 + bx + c$$
There are three coefficients — $a$, $b$, and $c$ — and this is not an accident. A quadratic has three degrees of freedom, which means we need exactly three pieces of information (say, three data points) to pin it down. A line has two coefficients ($y = mx + b$) and needs two points. A quadratic is one step more flexible.
Let's connect this back to our ball. We had three data points:
$(0, 2)$, $(1, 17)$, $(2, 22)$
Substituting each into $y = ax^2 + bx + c$:
- $t = 0$: $\quad a(0)^2 + b(0) + c = 2 \quad \Rightarrow \quad c = 2$
- $t = 1$: $\quad a(1)^2 + b(1) + 2 = 17 \quad \Rightarrow \quad a + b = 15$
- $t = 2$: $\quad a(4) + b(2) + 2 = 22 \quad \Rightarrow \quad 4a + 2b = 20$
From the last two equations: $4a + 2b = 20$ and $a + b = 15$. Subtracting twice the second from the first gives $2a = -10$, so $a = -5$ and $b = 20$.
The equation that fits our data is:
$$y = -5t^2 + 20t + 2$$
Let's verify with the point we didn't use yet — $t = 3$:
$$y = -5(9) + 20(3) + 2 = -45 + 60 + 2 = 17$$
This matches the table. The line gave us $y = 15(3) + 2 = 47$, which is absurdly wrong. The quadratic nails it.
What each coefficient tells us (a first look)
Don't try to memorize these yet — we'll spend the next section building intuition for them. For now, just notice:
- $c = 2$ is the height at $t = 0$ — the starting value. (Just like the $b$ in $y = mx + b$ is the $y$-intercept.)
- $a = -5$ is negative, which means the parabola opens downward. This makes physical sense: the ball goes up, then comes back down.
- $b = 20$ affects the initial rate of increase. We'll make this precise later.
Connection to what you know: A linear function $y = mx + b$ has two parameters and produces a straight line. A quadratic $y = ax^2 + bx + c$ has three parameters and produces a curve — specifically, a parabola. It's the simplest step up from a line. Every linear function is actually a special case of a quadratic where $a = 0$.
MathBox Visualization
Reflection
Let's step back and name what just happened.
We started with a real situation — a ball in the air — and discovered that the tool we already had (linear equations) wasn't enough. The data told us this: the rate of change wasn't constant.
But we didn't just notice the failure — we found a pattern in how the rate of change was changing. Constant second differences pointed us to a new kind of expression: $y = ax^2 + bx + c$. Three data points, three unknowns, one equation that fits perfectly.
What we learned: Linear functions describe constant change. Quadratic functions describe change that itself changes at a constant rate. They're the natural next step when lines break down.
Practice
Problem 1 — Concrete. A table of values is given:
| $x$ | 0 | 1 | 2 | 3 |
|---|---|---|---|---|
| $y$ | 1 | 4 | 11 | 22 |
(a) Compute the first and second differences. Is this quadratic?
(b) Use the three points $(0, 1)$, $(1, 4)$, $(2, 11)$ to find $a$, $b$, and $c$.
(c) Verify your equation with the point $(3, 22)$.
Solution
(a) First differences: $3, 7, 11$. Second differences: $4, 4$. Constant — this is quadratic. (b) From $(0,1)$: $c = 1$. From $(1,4)$: $a + b + 1 = 4$, so $a + b = 3$. From $(2,11)$: $4a + 2b + 1 = 11$, so $4a + 2b = 10$. Subtracting twice the first: $2a = 4$, so $a = 2$, $b = 1$. The equation is $y = 2x^2 + x + 1$. (c) At $x = 3$: $2(9) + 3 + 1 = 22$. It checks out.Problem 2 — Pattern. Without computing, decide: which of these tables is quadratic?
Table A:
| $x$ | 0 | 1 | 2 | 3 | 4 |
|---|---|---|---|---|---|
| $y$ | 0 | 1 | 4 | 9 | 16 |
Table B:
| $x$ | 0 | 1 | 2 | 3 | 4 |
|---|---|---|---|---|---|
| $y$ | 0 | 1 | 8 | 27 | 64 |
Solution
Table A: first differences $1, 3, 5, 7$; second differences $2, 2, 2$. Constant — **quadratic** ($y = x^2$). Table B: first differences $1, 7, 19, 37$; second differences $6, 12, 18$. Not constant — **not quadratic** (it's actually $y = x^3$).Problem 3 — Debug. A student claims that the data below is quadratic because "the numbers are getting bigger faster."
| $x$ | 0 | 1 | 2 | 3 | 4 |
|---|---|---|---|---|---|
| $y$ | 1 | 2 | 4 | 8 | 16 |
Are they right? Why or why not?
Solution
First differences: $1, 2, 4, 8$. Second differences: $1, 2, 4$. The second differences are **not** constant, so this is not quadratic. "Getting bigger faster" is not enough — it must get bigger faster *at a constant rate*. This data is actually exponential ($y = 2^x$).Problem 4 — Transfer. A small business tracks its total revenue over its first few months:
| Month | 1 | 2 | 3 | 4 | 5 |
|---|---|---|---|---|---|
| Revenue ($) | 500 | 1100 | 1900 | 2900 | 4100 |
(a) Is the revenue growing linearly, quadratically, or neither?
(b) If quadratic, find the equation using the first three data points.
Solution
(a) First differences: $600, 800, 1000, 1200$. Second differences: $200, 200, 200$. Constant — **quadratic growth**. (b) Using $(1, 500)$, $(2, 1100)$, $(3, 1900)$: - $a + b + c = 500$ - $4a + 2b + c = 1100$ - $9a + 3b + c = 1900$ Subtracting the first from the second: $3a + b = 600$. Subtracting the second from the third: $5a + b = 800$. So $2a = 200$, meaning $a = 100$, $b = 300$, $c = 100$. The equation is $y = 100t^2 + 300t + 100$. Check at $t = 4$: $1600 + 1200 + 100 = 2900$. Correct.What's Next
We now have a new kind of expression — $y = ax^2 + bx + c$ — and we know it produces a curve, not a line. But what does this curve actually look like? What role does each coefficient play? In the next section, we'll study the simplest quadratic, $y = x^2$, and build a complete picture of its shape.